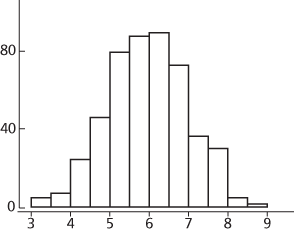
histogram
The figure shows a histogram of a sample of 500 observations. Compare bar chart.

A histogram
- absolutely convergent series
- absolutely summable
- absolute value
- absorbing set
- absorbing state
- absorption laws
- abstract algebra
- abstraction
- abundant number
- acceleration
- acceleration–time graph
- acceptance region
- acceptance sampling
- accessibility
- accumulation point
- accuracy
- accurate (correct) to n decimal places
- accurate (correct) to n significant figures
- Acheson, David
- Achilles paradox
- acnode
- action
- action, acts
- action limits
- active constraint