t-distribution
which gives the Cauchy distribution when ν = 1. The graph of f is similar in shape to a standard normal distribution, but is less peaked and has fatter tails. The distribution is used to test for significant differences between a sample mean and the population mean and can be used to test for differences between two sample means. The table gives, for different degrees of freedom, the values corresponding to certain values of α, to be used in a one-tailed or two-tailed t-test, as explained below.
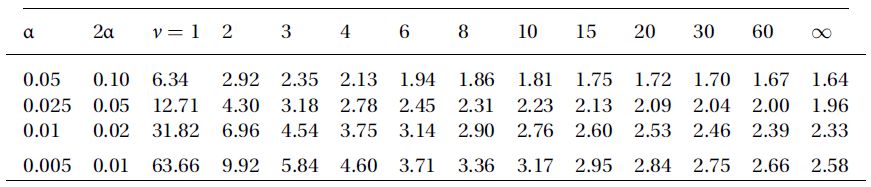
Values for one- and two-tailed t-test
Corresponding to the first column value α, the table gives the one-tailed value tα,ν such that Pr(t > tα,ν) = α, for the t-distribution with ν degrees of freedom. Corresponding to the second column value 2α, the table gives the two-tailed value tα,ν such that Pr(|t| > tα,ν) = 2α. Interpolation may be used for values of ν not included.
- Dirichlet beta function
- Dirichlet function
- Dirichlet, Peter Gustav Lejeune
- Dirichlet problem
- Dirichlet's approximation theorem
- Dirichlet series
- Dirichlet's test
- disc
- disc of convergence
- disconnected
- discontinuity
- discontinuous function
- discrete
- discrete data
- discrete Fourier transform
- discrete logarithm
- discrete mathematics
- discrete metric
- discrete random variable
- discrete space
- discretization
- discriminant
- discriminatory
- disjoint
- disjoint union